Warning: Very techie post, the noob version is here Google Spreadsheet Template for getting social activity around RSS feeds HT @dajbelshaw
In my last post announcing a Google Spreadsheet Template for getting social activity around RSS feeds I mentioned it was built from spare parts. It came out of on-going work at CETIS exploring activity data around CETIS blogs (including this one) and JISC funded projects. In this post I’ll highlight some of the current solutions we are using and how they were developed.
To put this work into context it aligns with my dabbling’s as a data scientist.
A data scientist … is someone who: wants to know what the question should be; embodies a combination of curiosity, data gathering skills, statistical and modelling expertise and strong communication skills. … The working environment for a data scientist should allow them to self-provision data, rather than having to rely on what is formally supported in the organisation, to enable them to be inquisitive and creative. [See this post by Adam Cooper for the origins of this definition]
It’s perhaps not surprising that the main tool I use for these explorations with data is Google Spreadsheets/Google Apps Script. The main affordances are a collaborative workspace which can store and manipulate tablature data using built-in and custom functionality. To illustrated this let me show how easy it is for me to go from A to B.
Example 1: OER Rapid Innovation Projects – Blog post social activity
I’ve already posted how we are Using Google Spreadsheets to dashboard project/course blog feeds #oerri. For this we have a matrix of project blog feeds and a set predefined categories/tags. As projects make different posts a link to them appears on the dashboard.

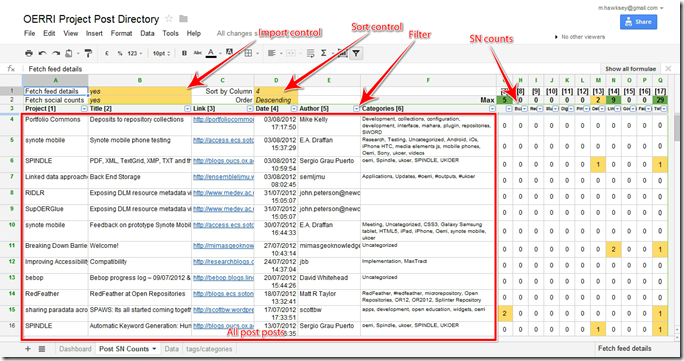
As part of the programme completion JISC are piloting a new project survey which will include reporting the ‘reach of the papers/articles/newsitems/blogposts out of the project’. Out of curiosity I wanted to see what social share and other activity data could be automatically collected from project blogs. The result is the page shown below, which is also now part of the revised OERRI Project Post Directory Spreadsheet. The important bit is the columns on the right with social counts from 10 different social network services. So we can see a post by Xenith got 29 tweets, a post by bebop got 5 comments, etc.
Caveat: these counts might not include modified urls with campaign tracking etc …
How it works
The three key aspects are:
- Getting a single sheet of blog posts for a list of RSS feeds.
- Getting social counts (Likes, Tweets, Saves) for a range of services.
- Allowing columns sorting on arrays of results returned by custom
Getting a single sheet of blog posts
You can use built in formula like importFeed to do this, but you are limited to a maximum 20 post items and you need to do some juggling to get all the results from 15 projects in one page. An alternative, which I quickly ruled out was fetching the rss xml using Google Apps Script and parsing the feed. The issue with this one is RSS feeds are usually limited to the last 10 posts and I wanted them all.
The solution was to use the Google Feed API (can’t remember if this is on Google cull list). The two big pluses from this are it can pull historic results (up to 100 items), and results can be returned in JSON which is easy to work with in App Script.
Here’s what the function looks like which is called as a custom formula in cell Data!A4 (formula used looks like =returnPostLinks(Dashboard!A3:B17,”postData”)):
function returnPostLinks(anArray,cacheName){
  var output = [];
  var cache = CacheService.getPublicCache(); // using Cache service to prevent too many urlfetch
  var cached = cache.get(cacheName);
  if (cached != null) { // if value in cache return it
    output = Utilities.jsonParse(cached);
    for (i in output){
      output[i][3] = new Date(output[i][3]); // need to recast the date
    }
    return output; // if cached values just return them
  }
  // else make a fetch
  var options = {"method" : "get"};
  try {
    for (i in anArray){ // for each feed url
      var project = anArray[i][0]; // exact the project name from 1st col
      if (project != ""){ // if it's not blank
        var url = "https://ajax.googleapis.com/ajax/services/feed/load?v=1.0&num=100&q="+anArray[i][1];
        var response = UrlFetchApp.fetch(url , options);
        var item = Utilities.jsonParse(response.getContentText()).responseData.feed.entries; // navigate to returned items
        for (j in item){
          // for each item insert project name and pull item title, link, date, author and categories (other available are content snippet and content)
          output.push([project,item[j].title,item[j].link,new Date(item[j].publishedDate),item[j].author,item[j].categories.join(", ")]);
        }
      }
    }
    // cache the result to prevent fetch for 1 day
    cache.put(cacheName, Utilities.jsonStringify(output), 86400); // cache set for 1 day
    return output; // return result array
  } catch(e) {
    //output.push(e);
    return output;
  }
}
Getting social share counts
Collecting social share counts is something I’ve written about a couple of times so I won’t go into too much detail. The challenge is this project was to get results back from over 100 urls. I’m still not entirely sure if I’ve cracked it and I’m hoping more result caching helps. The issue is because the custom formula used in this appears in each row of column H on the Data sheet, when the spreadsheet opens it simultaneously tries to do 100 UrlFetches at the same time which Apps Script doesn’t like (Err: Service has been invoked too many times). {I’m wondering if away around this would be to set a random sleep interval (Utilities.sleep(Math.floor(Math.random()*10000))… just tried it and it seems to work}
Sorting columns when arrays of results are returned by custom formula

Time to hack together: functional in 2hrs, tweaks/cache fixes 4hrs
Example 2: JISC CETIS Blog Post Dashboard
Having got social share stats for other peoples feeds it made sense for the JISC CETIS blogs. At the same time because I keep my blog on my own domain and Scott (Wilson) is on wordpress.com it was also an opportunity to streamline our monthly reporting and put all our page views in one place.
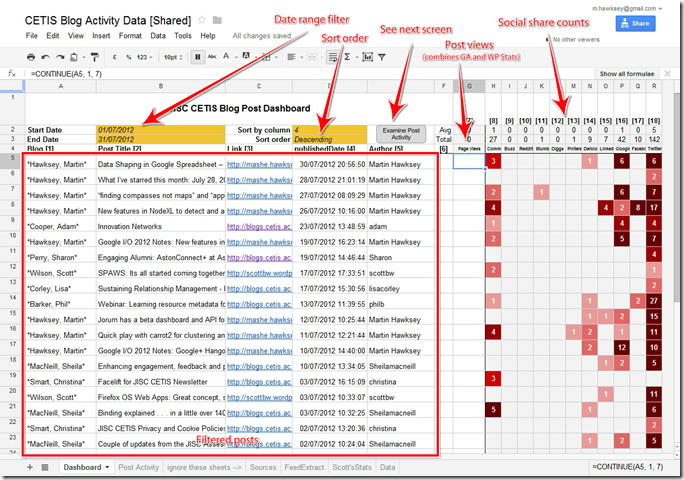
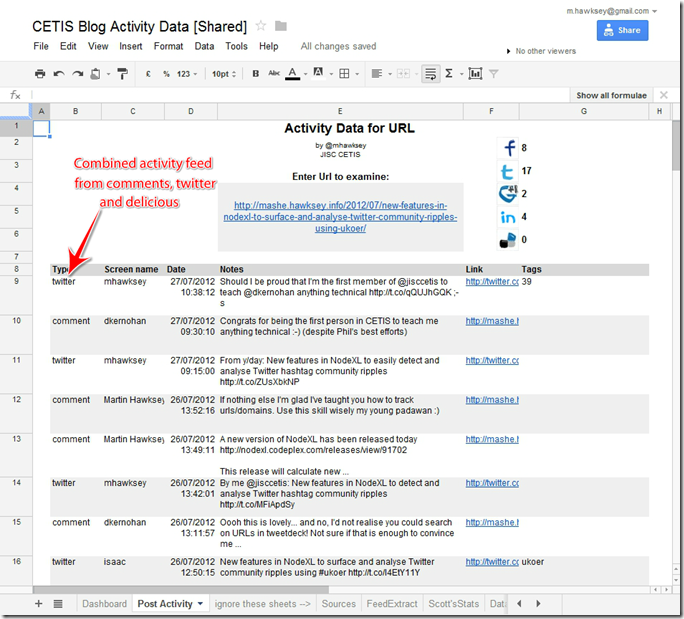
Below is a screenshot of this de-page viewed version of the CETIS dashboard (the code is all there I’ve just haven’t authenticated it with our various Google Analytic accounts). With this version the user can enter a date range and get a filtered view of the posts published in that period. Sort and social counts make a re-appearance with the addition of an ‘Examine Post Activity’ button. With a row highlighted, clicking this gives individual post activity (shown in the second screenshot). The code for this part got recycled into my last post Google Spreadsheet Template for getting social activity around RSS feeds.
Getting to B
To get to this end point there are some steps to pull the data together. First the ‘Sources’ sheet pulls all our blog urls from the CETIS contacts page using the importHtml formula. Next on the ‘FeedExtract’ sheet the array of blog urls is turned into a sheet of posts using the same code in example 1. Social counts are then collect on the ‘Data’ sheet which is read by the Dashboard sheet.
A detour via page views
Having some existing code to get stats from Google Analytics made it easy to pass a url to one of two GA accounts and get stats back. Because Scott is on wordpress.com another way was required. Fortunately Tony Hirst has already demonstrated a method to pull data from the WordPress Stats API into Google Spreadsheets. Following this method stats are imported to a ‘Scott’sStats’ sheet and tallied up with a code loop (WordPress stats come in on per post, per day).

Here’s the custom formula code to return page views for a url:
function getCETISPageViews(url, startDate, endDate){
  // format dates
  var startDate = Utilities.formatDate(startDate, "BST", "yyyy-MM-dd");
  var endDate = Utilities.formatDate(endDate, "BST", "yyyy-MM-dd") ;
  // extract domain and path
  var matches = url.match(/^https?\:\/\/([^\/:?#]+)(?:[\/:?#]|$)/i);
  var domain = matches && matches[0];
  var path = url.replace(domain,"/");
  // switch for google analytic accounts
  var ids = false;
  if (domain == "https://hawksey.info/blog/"){
    ids = ""//ga-profile-id
  } else if (domain == "http://blogs.cetis.ac.uk/"){
    ids = ""//ga-profile-id;
  } else if (domain == "http://scottbw.wordpress.com/"){
    // code to compily stats imported to sheet
    // get all the values
    var doc = SpreadsheetApp.getActiveSpreadsheet();
    var sheet = doc.getSheetByName("Scott'sStats")
    var data = sheet.getRange(1, 4, sheet.getLastRow(), 2).getValues();
    var count = 0;
    // count on url match
    for (i in data){
      if (data[i][0] == url) count += data[i][1];
    }
    return parseInt(count);
  }
  if (ids){
    // GA get data using sub function
    return parseInt(getGAPageViews(startDate, endDate, path, 1, ids));
  }
}
Note: I use a custom Google Analytics function available in the spreadsheet script editor. There’s a new Analytics Service in Apps Script as an alternative method to connect to Google Analytics.
Time to hack together: functional in 3hrs, tweaks fixes 1hr
Summary
So there you go two examples of how you can quickly pull together different data sources to help us record and report the social reach of blog posts. You’ll notice I’ve conveniently ignored whether social metrics are important, the dangers of measurement leading to gaming, the low recorded social activity around OERRI projects. I look forward to your comments 😉


How JISC CETIS dashboard social activity around blog posts using a splash of data science | Google Apps Script | Scoop.it
[…] Behind the scences look at how we (JISC CETIS) can quickly develop dashboards to monitor activty around blog posts (using Google Spreadsheets of course ;)… […]
How JISC CETIS dashboard social activity around blog posts using a splash of data science | Learning Resources(RSC) | Scoop.it
[…] Behind the scences look at how we (JISC CETIS) can quickly develop dashboards to monitor activty around blog posts (using Google Spreadsheets of course ;)… […]
IFTTT: IF I do THAT on {insert social network/rss feed/other} THEN add row to Google Spreadsheet JISC CETIS MASHe
[…] are limited to the last 10 or so items. This has created problems in some of my projects like the OERRI Projects Dashboard where I need all the posts. The solution to date has been to rely on 3rd party services like the […]
Converting blog post urls into MS Word documents using Google Apps Script #oerri JISC CETIS MASHe
[…] As part of the JISC OER Rapid Innovation Programme we’ve been experimenting with monitoring project blogs by gluing together some scripts in Google Spreadsheets. First there was Using Google Spreadsheets to dashboard project/course blog feeds #oerri which was extended to include social activity around blog posts. […]