Earlier today I said:
@mhawksey
Martin HawkseyUploaded data from NodeXL to Google Spreadsheet then rendered edges in browser. 203 nodes 1913 edges processed okay bit.ly/ua0PEx
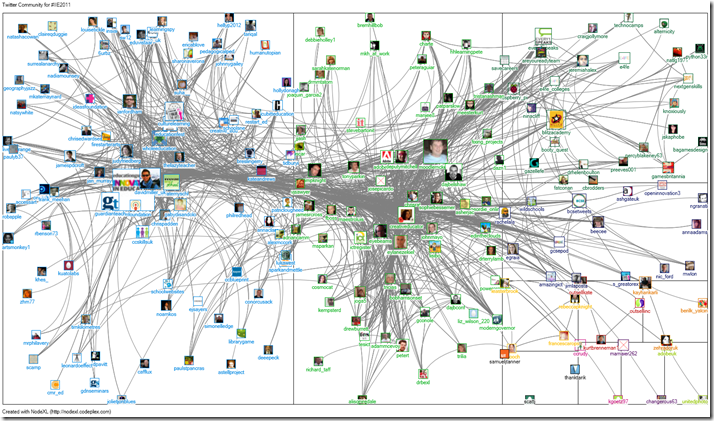
For a bit more detail on how I did it. I used my TAGS template to capture tweets from the #IIE2011 event yesterday. This template includes a summary sheet which uses a spreadsheet formula to create a unique list of all the people who used the hashtag in the archive. All I did was paste this list into the Import > From Twitter list network in NodeXL. A couple of ‘Graph metrics’ and Autofills later I had a very nice overview of the #IIE2011 twitter community:
As a little experiment I flattened the NodeXL .xlsx spreadsheet by edit > copy, edit > paste values to and saved as .xls allow me to import it back into my original Google Spreadsheet using Import > Insert new sheet(s) (I was pleasantly surprised that the import also included the Overall Metrics charts, although I did have to edit them to swap the x-y axis data source columns).
Finally after File > Publish to the web… I was able to set it as the data source for my EDGESExplorer tool giving:

Here’s the live version (use your mouse scroll to zoom)
So my browser (Chrome) on a decent spec laptop rendered 203 nodes, 1913 edges okay. Things I would want to improve would be to scale node text on other metrics than degree, preserve the grouping data and layout in a box. All of these look doable for networks of a similar size.
PS the TAGSExplorer visualisation of #IIE2011 tweets is here (I added a new tab to this to list nodes by degree, the higher the degree indicates the person made or received more @replies)
