When the Irish Learning Technology Association’s (ILTA) call for proposals came out earlier in the year around the theme of ‘TEL in an Age of Supercomplexity- Challenges, Opportunities and Strategies‘ I immediately wanted to submit a proposal around making the complex less complicated using network analysis. The seed for this proposal dates from 2012 when Professor Paul Hollins shared a link to a video with Eric Berlow.
RT @PaulHollins: One for @mhawksey RT @hjarche: complexity made simple http://t.co/XyvlTbOk <@psychemedia useful prez vid
— Martin Hawksey (@mhawksey) March 22, 2012
The video unfortunately no longer exists but in it Eric Berlow shows how network analysis can provide insight to seemingly complex systems (a similar talk is available on TED).
Patterns are left behind. Whether it be replies to a discussion forums, interactions on social media or ingredients in cocktails links can be made and the data used for actionable insight. Network science is one approach that takes these seemingly complex connections and through the use of mathematical methods make it easier to understand. Network science is a well established discipline and it’s origins can be traced to 1736 and the work of Leonhard Euler. The area of social network analysis is a more recent development established in work by Moreno and Jennings in the 1930s. Accessibility to affordable computing in the 1990s combined with data from early social networks like IRC has led to an explosion of interest in social network analysis. This has continued with the emergence of social networking sites like Facebook and Twitter combined with accessibility to the underlying data. The use of network science and social network analysis within educational contexts has seen similar growth. The emergence of ‘Learning Analytics’ as a field of study has highlighted how data can be used to enhance learning and teaching. With social network analysis we can take seemingly complex relationships and making them less complicated. Common applications of network analysis in this area include: identification of isolated students within group activities; identification of people or concepts which are ‘network bridges’; clustering of categorisation of topics; plus numerous other applications.
This presentation is designed to be an introduction into network analysis allowing delegates the opportunity to understand the underlying structure of the graph as well as some of the tools that can be used to construct them. The session will begin with an introduction to key network analysis terms and go on to introduce some of the tools and techniques for social network analysis, specifically looking at how data can be collected and analysed from Twitter using tools like TAGS and NodeXL.
In my original proposal I submitted a 10 minute practitioner session and had planned to incorporate the video into a longer piece introducing network analysis. As it turned out EdTech was again oversubscribed and rather than rejecting the proposal I was offered a 5 minute slot. In planning the session I dropped the TED video but still found myself confronting a ‘Weller’** with 27 slides … 57 cats also featured. You can watch the session in all it’s glory in this video (my presentation is around the 43 minute mark). I’ve also annotated the slides below, the deck is also available on Slideshare and Onedrive.
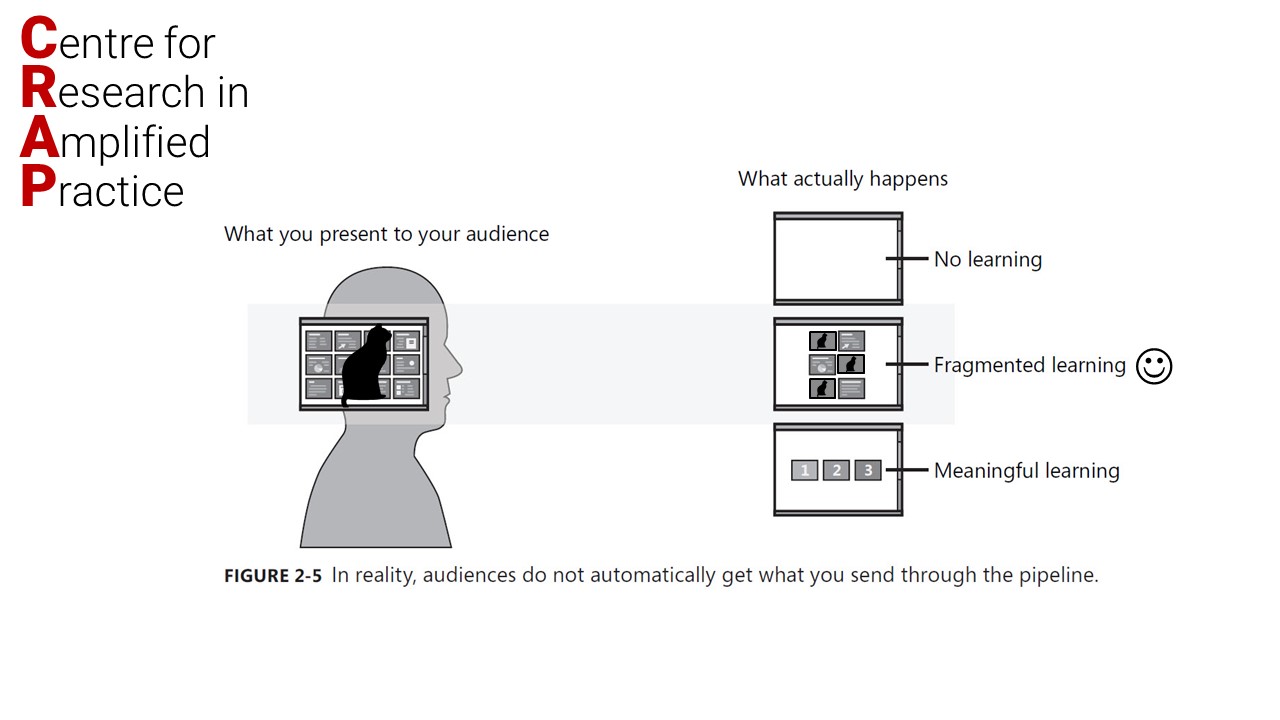
I’m not sure everyone in the audience got the Centre for Research in Amplified Practive (CRAP) joke. Perhaps because it was a litterally a … well, crap joke. My thinking was becuse network science wouldn’t be for everyone including cat picture would at least mean they had something nice to look at. Figure 2-5 (without cats) is actually taken from ‘Beyond Bullet Points’, Cliff Atkinson’s book which provides guidance in avoiding cognitive overload when using PowerPoint. In my talk I suggested that includion of cats still results in fragmented learning but it’s happy fragmented learning.
Finally getting to my title slide I wanted to take the opportunity to say that while I was employed by the Association for Learning Technology the area of social network analysis was very much a hobby … which I repeat here as I’m sure there will be readers of this post who are infinitely more knowledgeable on this topic.
“Social Network Analysis is my hobby not my job” @mhawksey #iltaedtech17
— Lawrie Phipps (@Lawrie) June 2, 2017
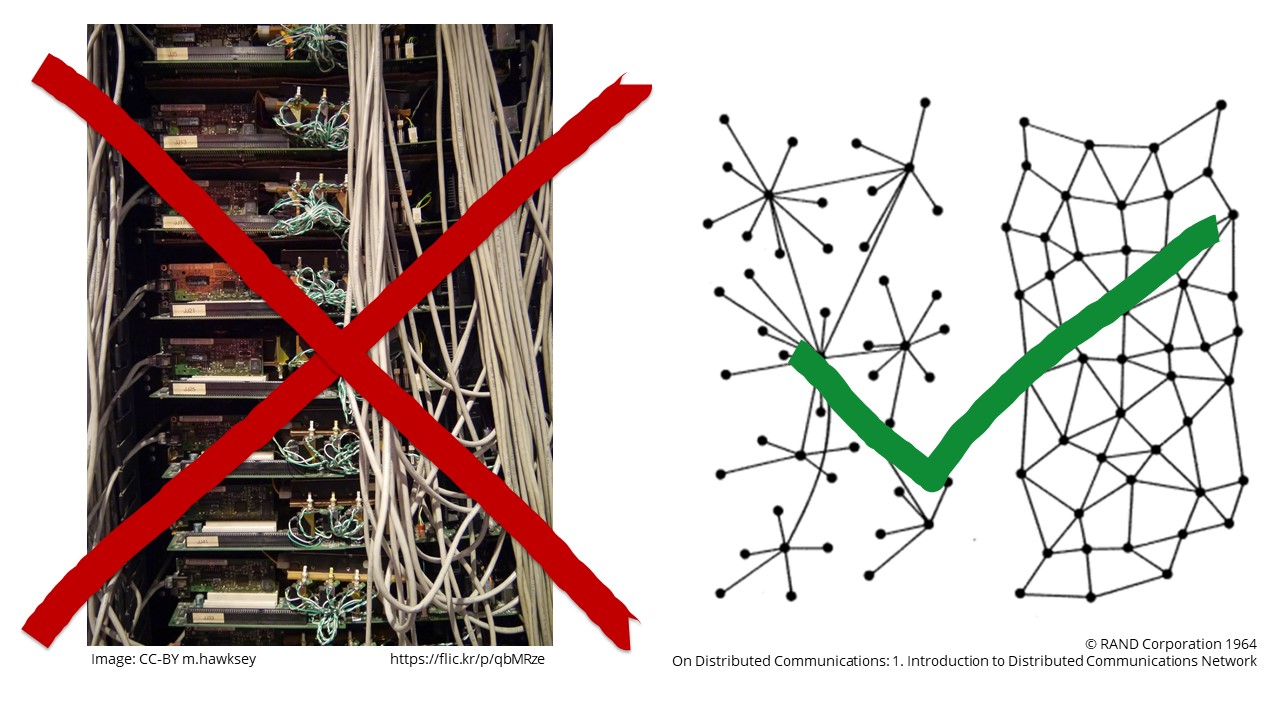
Something else I wanted to clarify was I was talking about social networks rather than servers, switches, TCP/IP … I included as I’d previously experienced this (I avoid confusing the matter by highlighting the network diagram is actually from the discussion paper on ARPANET which eventually was the backbone of the Internet or that you could use network science to analysis network architecture).
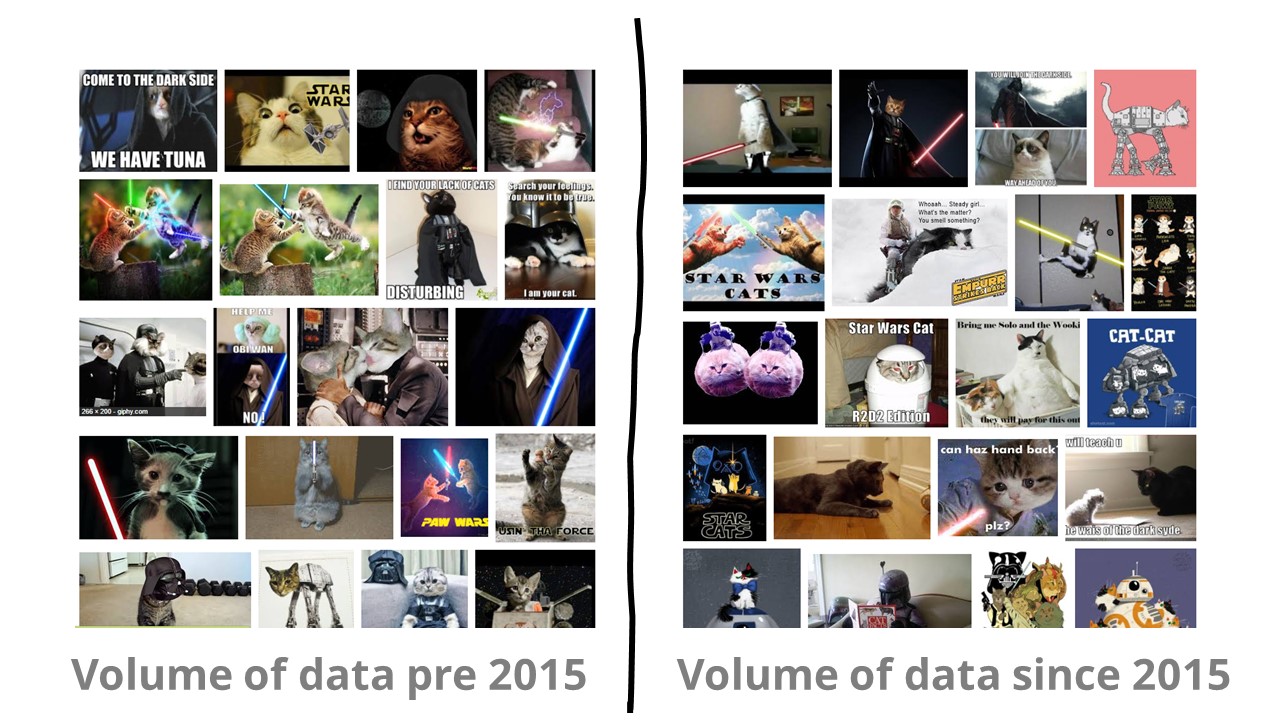
From my slide notes … in the last two years we have doubled the amount of data stored [not sure if this is true and I’ve no references but passed my ‘sounds about right test’. We are in unprecedented times.

Previously the census may have recorded my name, where I live and occupation, but now so much of our activity is recorded, digital footprints are everywhere. This is a huge ethical concern but I believe there are situations where we can use this data is a positive way to improve learning, life and society. But how can we make sense of these complex interactions.
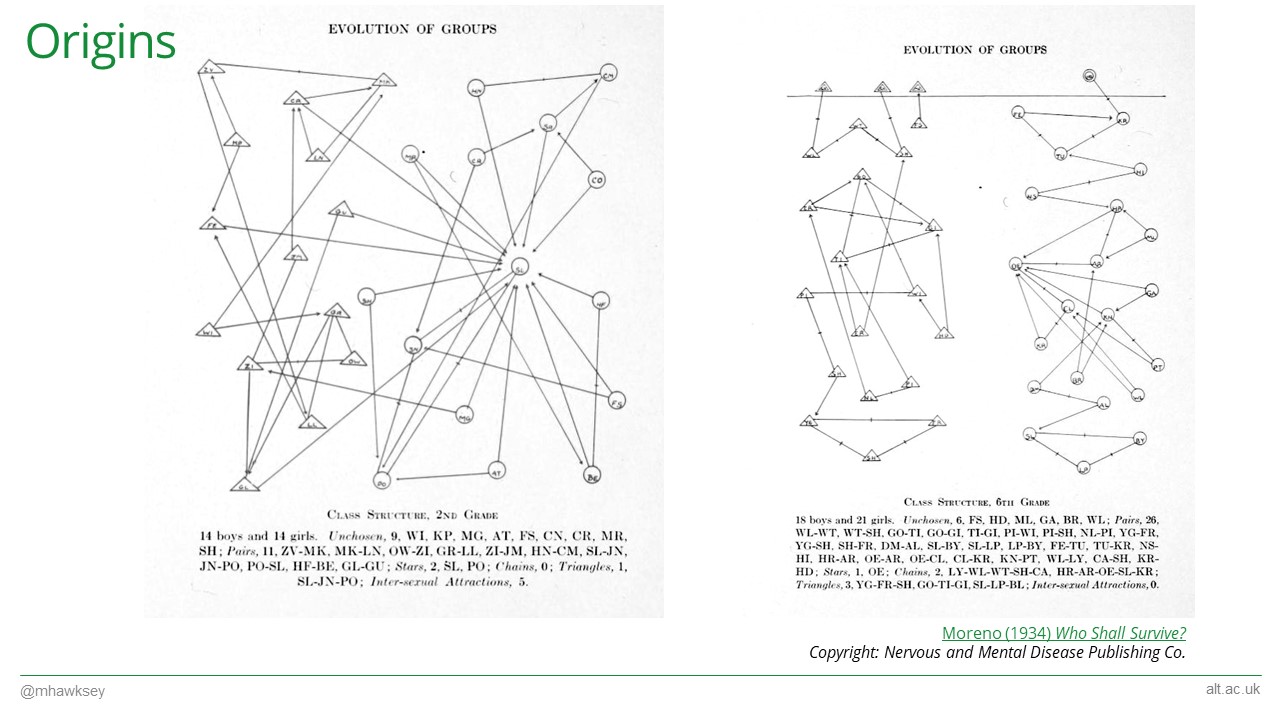
One solution is network science. This isn’t a new field of study although the emergence of affordable computing and access to data has accelerated it’s growth. From a social perspective Jacob Moreno is often cited as the inventor of sociagrams. These graphs (from Who Shall Survive?) show the relationships between groups of school pupils. Before going further with what’s possible using network analysis some terminology/concepts.
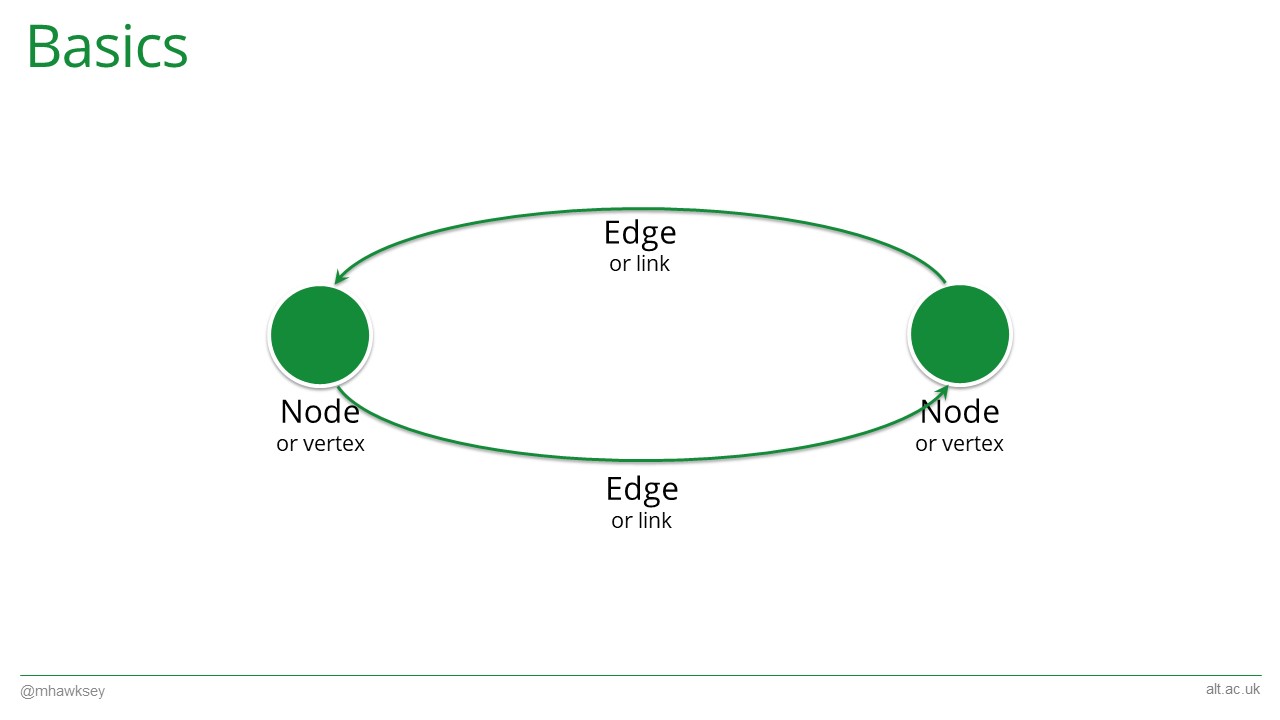
A point is a node (or vertex) … connections between nodes are called edges or links. In this example the edges are directed. For example, on twitter I can follow you but you might not follow me back (directed), but on Facebook two people are friends so it’s undirected. Nodes can be anything not just a person. They could be an email, discussion post, ingredient etc.

Now for the science bit. Having created networks we can makes and use different metrics. For example, we can count the number of connections a node has. This is called ‘degree’.
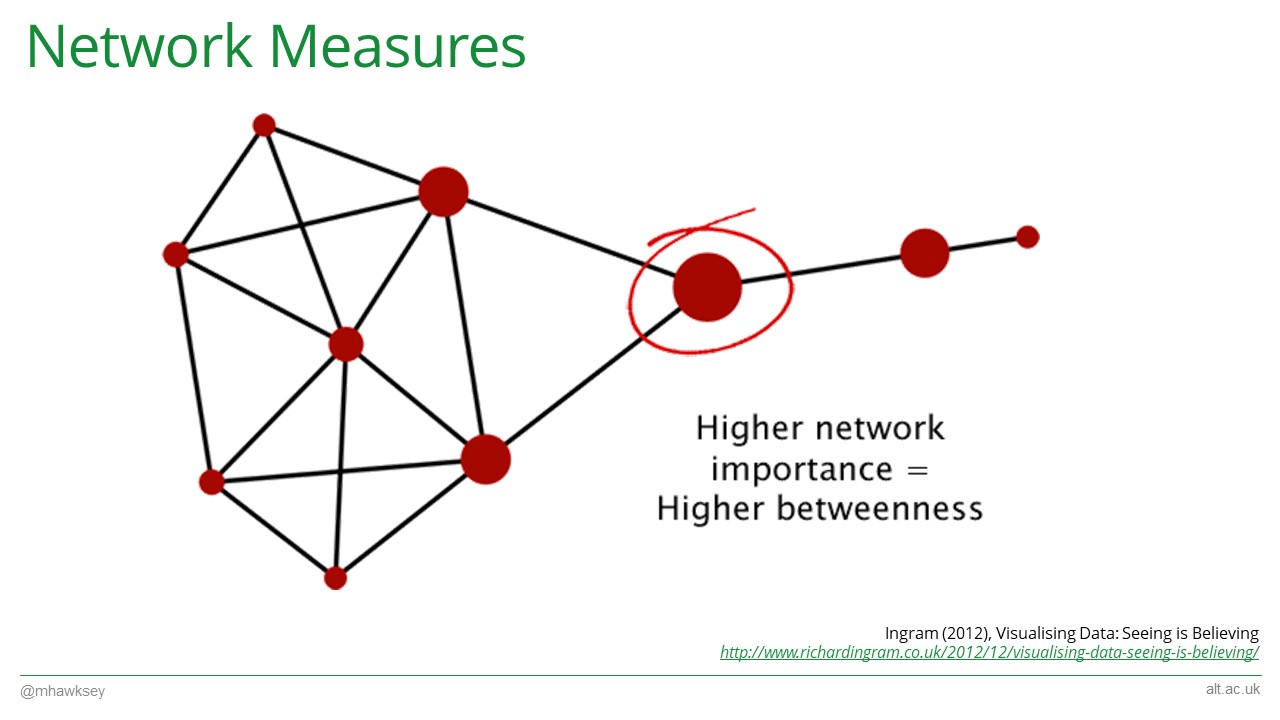
There are a number of measures we can use and other the years various algorithms have been developed to analysis networks providing methods looking density within graphs, clustering, layout and more. For example, often you can calculate ‘betweenness centrality’. “Betweenness Centrality measures how often a node appears on the shortest paths between nodes in a network. So by ranking each node within a social network by betweenness centrality, we can distinguish which influential individuals have the most connections across distinct community clusters” [Source]
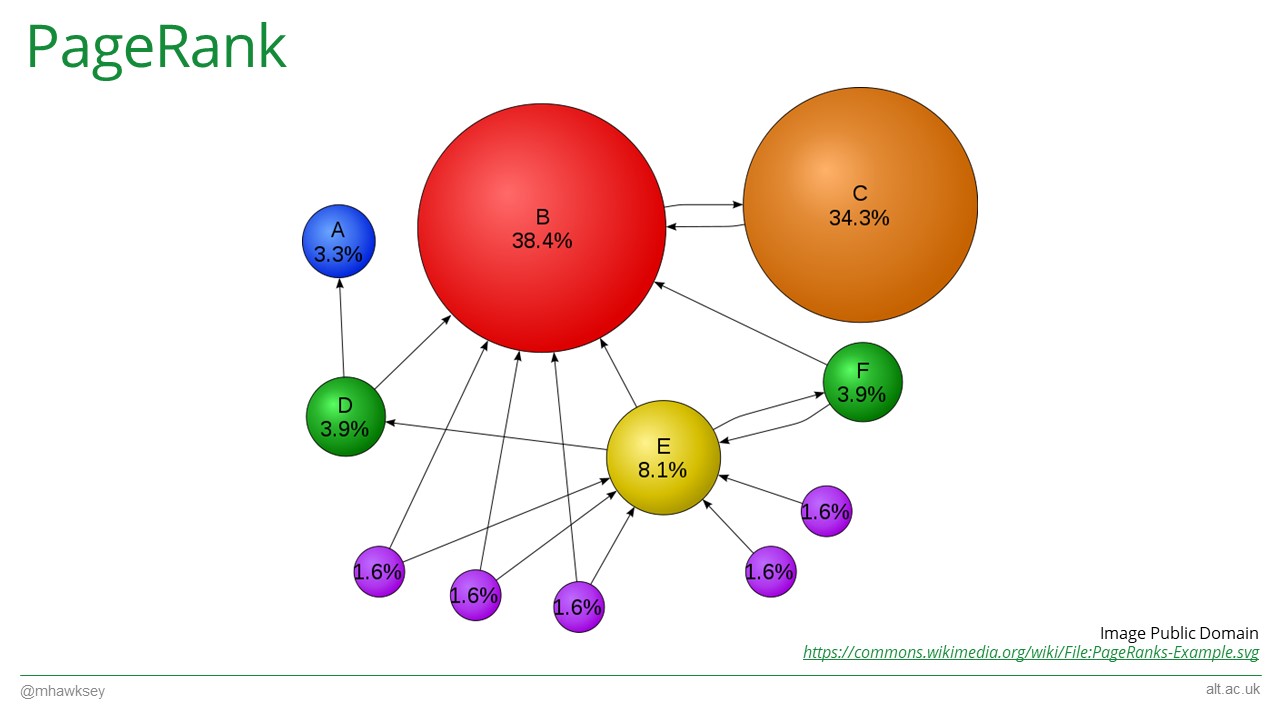
You might have head of some of the other network analysis tools. Have you heard of PageRank? PageRank was the algorithm developed by Larry Page and Sergey Brinn which they later used to found Google. Whilst the algorithm Google uses for listing search results has changed the original research is still used in network analysis
“The PageRank graph is generated by having all of the World Wide Web pages as nodes and any hyperlinks on the pages as edges. The edges are further characterized as weak or strong edges by weighting the edges. Pages that are linked by more credible sources such as CNN or USA.gov sites have higher weightings for the respective edges. Thus, if we compare two sites with the same number of edges. PageRank will give the site with more links to credible sources a better rank.” [Source]
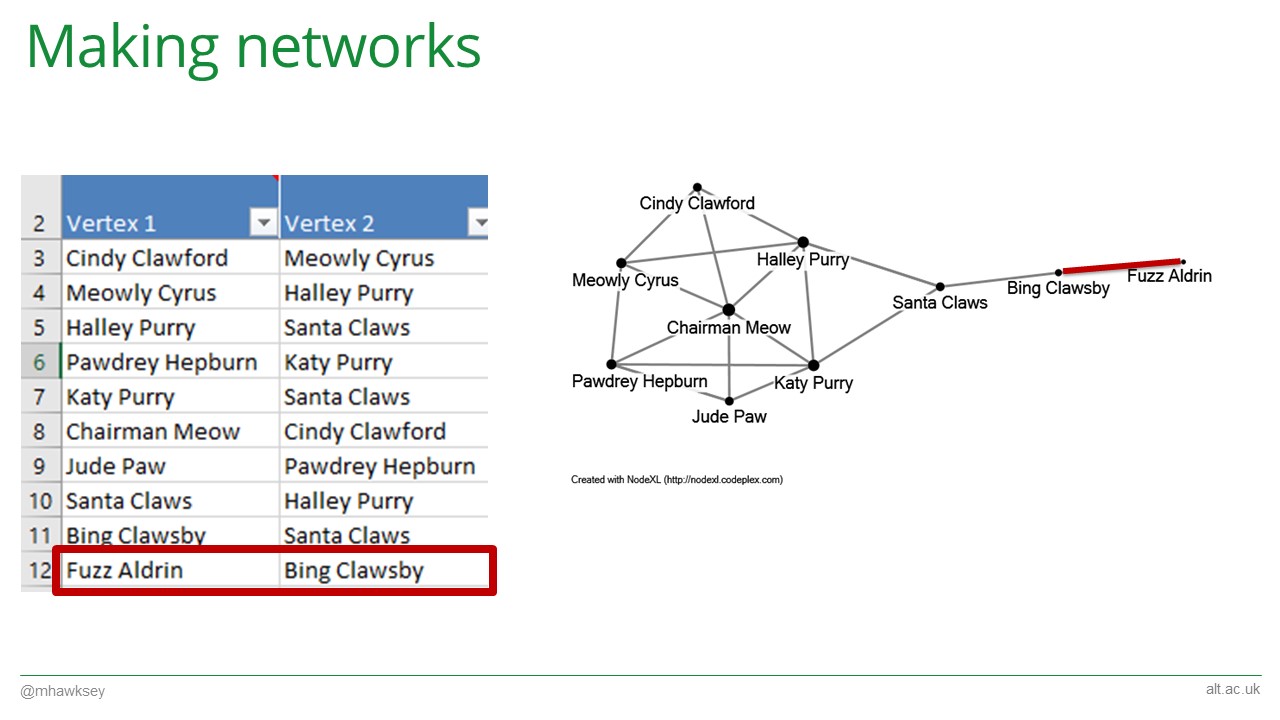
Threshold concept for me was that a lot of software builds networks from a paired list. So if you can find ties between thing A and thing B you can start creating networks. For example, in this diagram we can connect Fuzz Aldrin and Bing Clasby with the row highlighted.
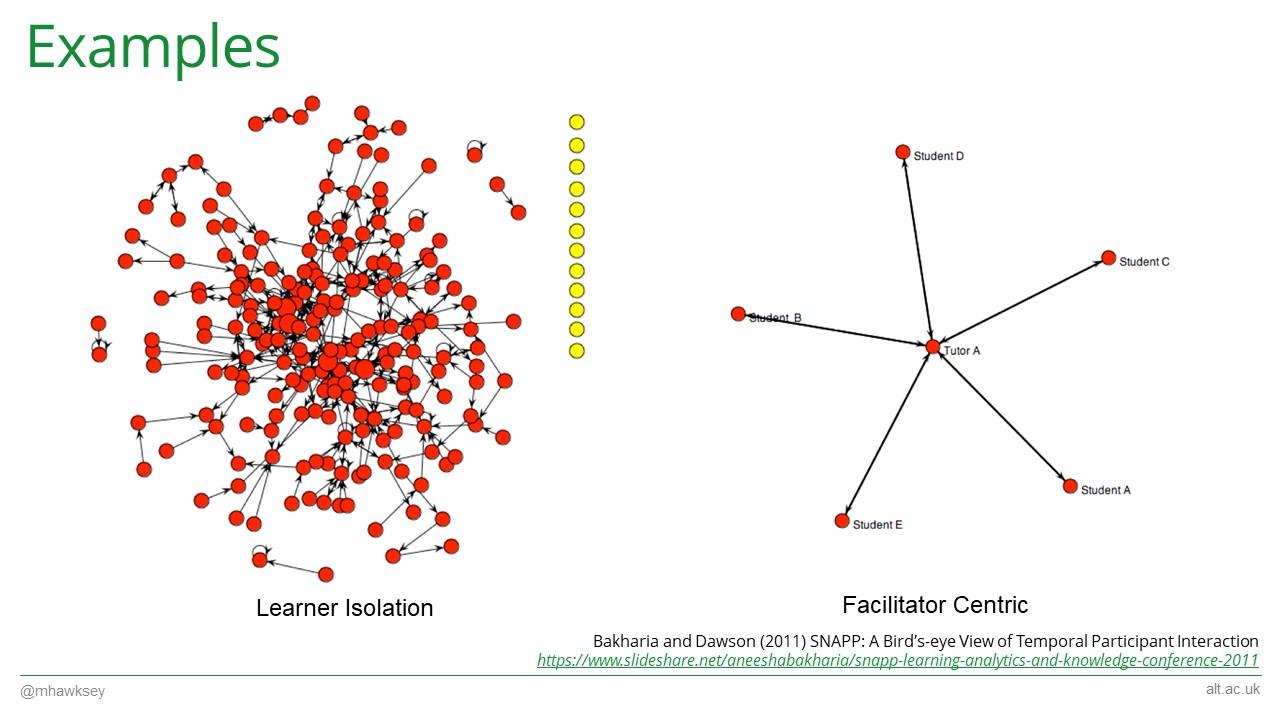
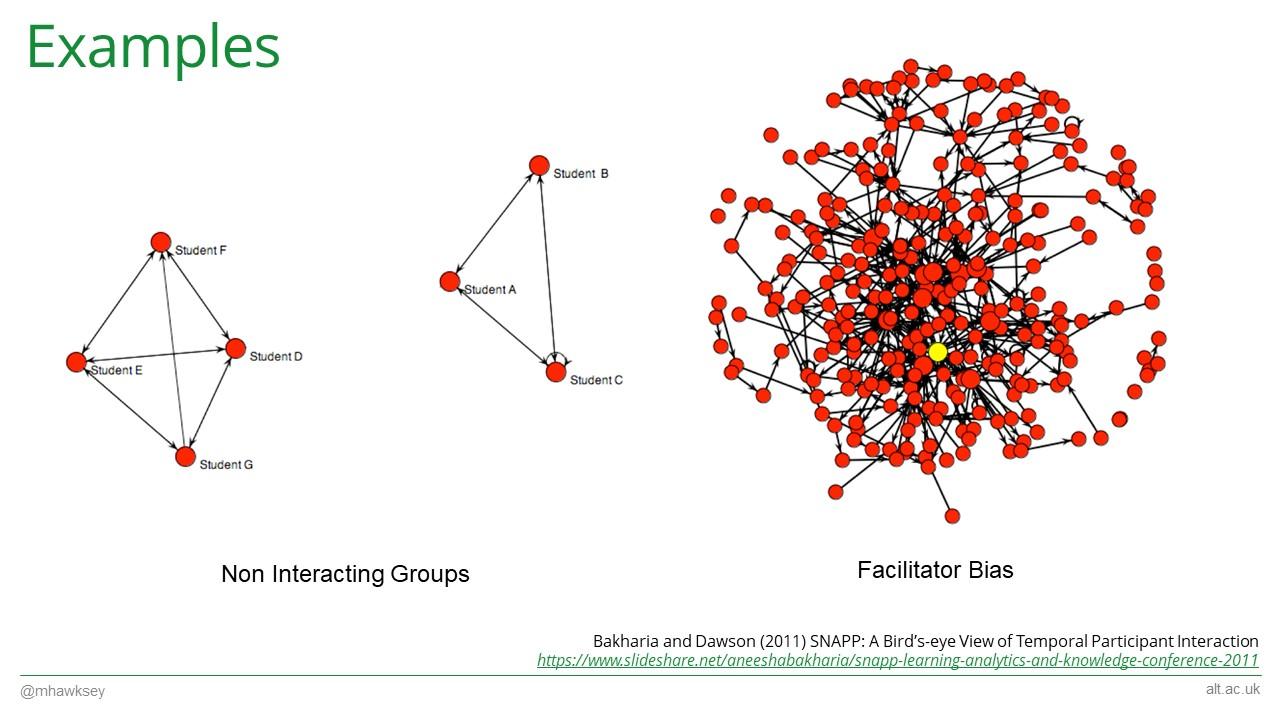
At this point I was running out of time and whizzed through some examples of social network analysis applied to learning and teaching from Bakharia and Dawson (2011) SNAPP: A Bird’s-eye View of Temporal Participant Interaction. The article is unfortunately pay walled but you might be able to piece it together from the Slideshare deck.

Fur Ball was my lead in to ‘hairball’ networks…
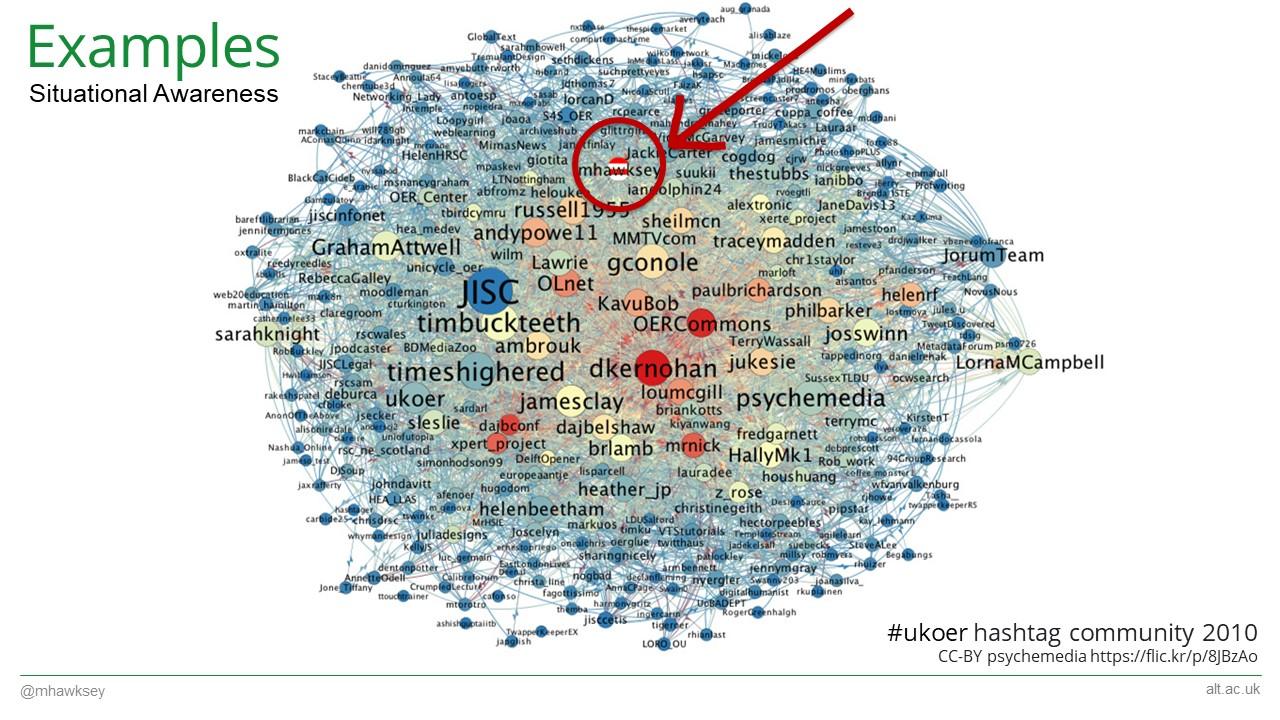
This is one of the first graphs that got me interested in network analysis. It was produced by Tony Hirst at the OU who had just started exploring network analysis techniques himself. The graph shows the connections between Twitter screen names for a community hashtag (#ukoer). Looking at this graph one of the personally powerful and motivational revelations was to see I was part of a community. If you consider a medium like Twitter it can be hard for you to get a sense of where you are in a community and who else is part of it. Seeing myself exist in the graph gave me a sense of place but it also let me see who else in the community I was close to but not connected with, or even discover people on the other side, removed from me by several degrees.
Next a slide with a quote from Ben Fry:
Graphs can be a powerful way to represent relationships between data, but they are also a very abstract concept, which means that they run the danger of meaning something only to the creator of the graph. Often, simply showing the structure of the data says very little about what it actually means, even though it’s a perfectly accurate means of representing the data. Everything looks like a graph, but almost nothing should ever be drawn as one. Ben Fry in ‘Visualizing Data‘
One criticism of graphs, all graphs, not just network graphs, is often they are only truly meaningful for the creator of the graph. So we’ve taken something complex and made it more complicated. One thing to remember within network analysis is whilst the research paper or blog post reporting on the analysis conducted contains a static image it is through the active exploration or the graph that the real answers are revealed.
Had I more than 5 minutes I would of ‘paused’ at this point to reflect on exploratory/interactive analysis … [the paws joke was lifted from a presentation by Jake Secker].
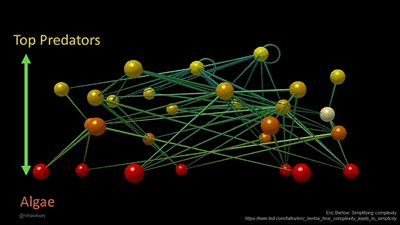
To illustrated this point I used one of the examples from Eric Berlow’s TED talk mentioned earlier, highlighting how focusing on a single node and those within one or two degrees can help make the complex less complicated.
At this point squeezed in a reference to TAGS/TAGSExplorer with the oppourtunity to look at the #iltaedtech17 hashtag go.alt.ac.uk/iltaedtech17-tags.
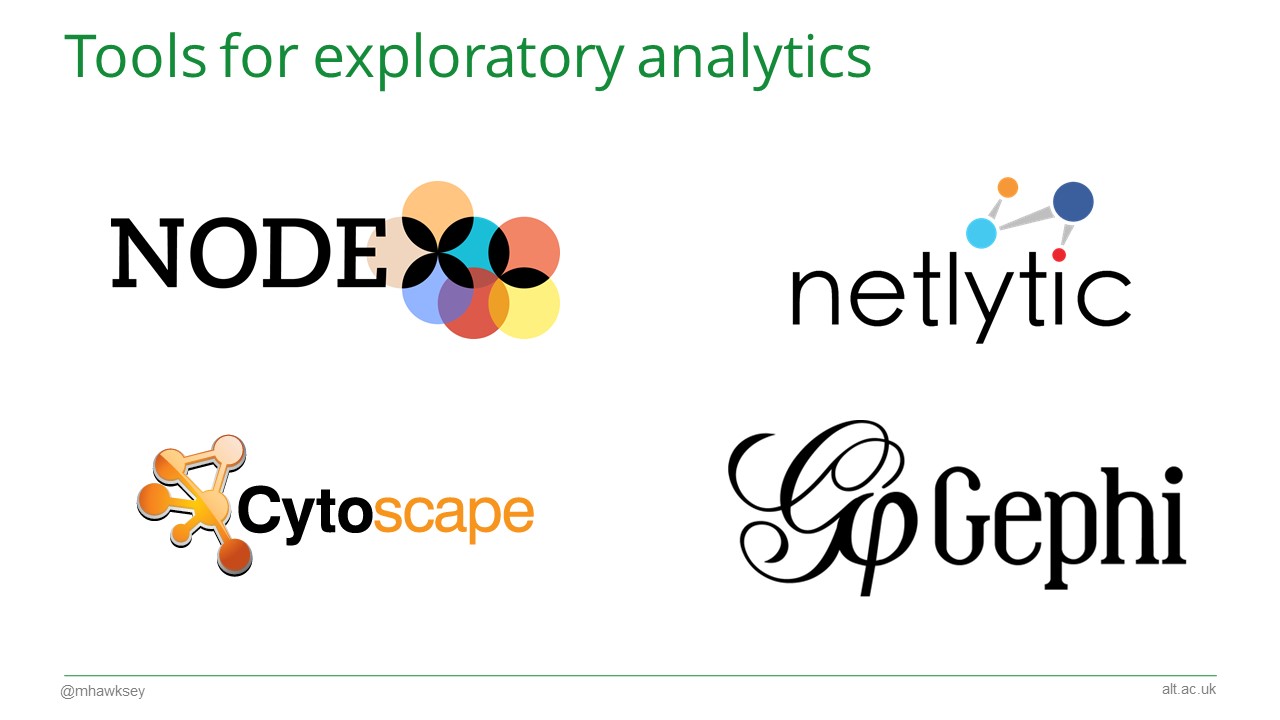
Fortunately there is a long list of tools, many open source, designed for the exploratory analysis of networks. A couple I highlighted were Cytoscape, Gephi, NodeXL and Netlytics. For social network analysis, particularly of Twitter, I signposted:
- Using Twitter as a data source: an overview of social media research tools (updated for 2017)
- Twitter: How to archive event hashtags and create an interactive visualization of the conversation
And some key points:
- Getting an edge list and you are over 80% or the way
- There are a lot of very knowledgeable people in the community willing to help
- Go explore … and have fun
No cat picture to finish with (missed opportunity). Thanks to ILTA for the opportunity to speak. Feel free to use the post comments for follow up questions.