Back in 2015 I shared a post on Tips on emailing inline Google Charts from Sheets using Apps Script, which looked at how you can email charts from Google Sheets. This solution is one I use in my work on a daily basis and remains largely unchanged. One of the pain points with this solution is the need to rebuild the chart options to get it to appear the same way as in Google Sheets. More recently I was faced with the problem that I couldn’t include a Combo Chart. In this post I revisit this problem and share a solution for including copies of your Google Sheet charts in your email reports. You can make a copy of this Google Sheet example, which includes the solution code, but for those interested lets first recap the issues with inline charts from Google Sheets.
Basics of email inline images
Within MailApp and GmailApp there is the inlineImages advanced parameters for including inline images within sent email. The documentation specifies this as:
a JavaScript object containing a mapping from image key (
String) to image data (BlobSource); this assumes that the htmlBody parameter is used and contains references to these images in the format<img src="cid:imageKey" />
The documentation includes an example that fetches images and inlines them in an email.
Issue with Google Sheets chart getAs()
The ‘inline images’ example can be modified to fetch chart objects in Google Sheets and using getAs() which return as an image Blob as demonstrated in the code example below:
// Based on https://stackoverflow.com/a/22200230/1027723
function emailChartSourceImage(){
  const sheet = SpreadsheetApp.getActiveSheet();
  const charts = sheet.getCharts();

  // setup some variables for our email
  const chartBlobs = new Array();
  const emailImages = {};
  let emailBody = "Charts<br>";

  // for each chart in the sheet getAs an image blob and appended
  charts.forEach(function(chart, i){
    chartBlobs[i] = chart.getAs("image/png");
    emailBody += "<p align='center'><img src='cid:chart"+i+"'></p>";
    emailImages["chart"+i] = chartBlobs[i];
  });

  // Send email with inline images
  MailApp.sendEmail({
    to: "[email protected]",
    subject: "Email Charts - get chart as image",
    htmlBody: emailBody,
    inlineImages:emailImages});
}
This script runs without error but the issue is the getAs() method does not always respect all the chart options as shown in the examples below:
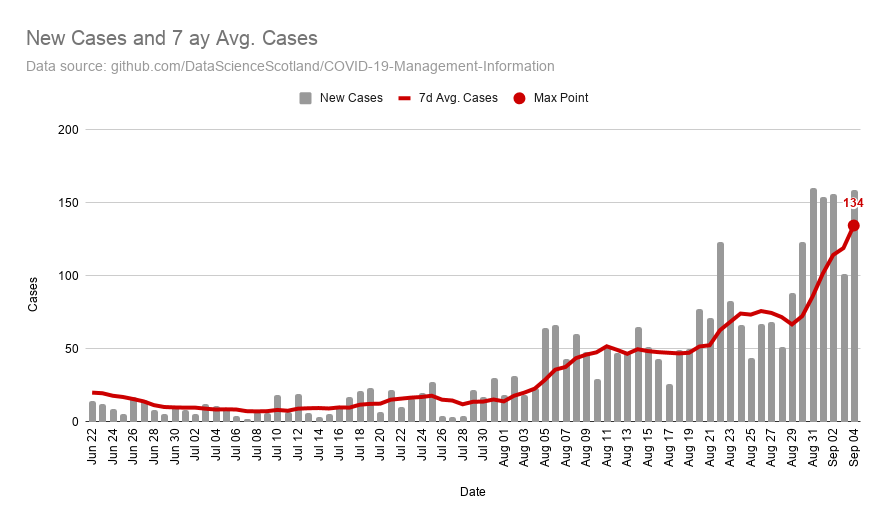 Original Chart | 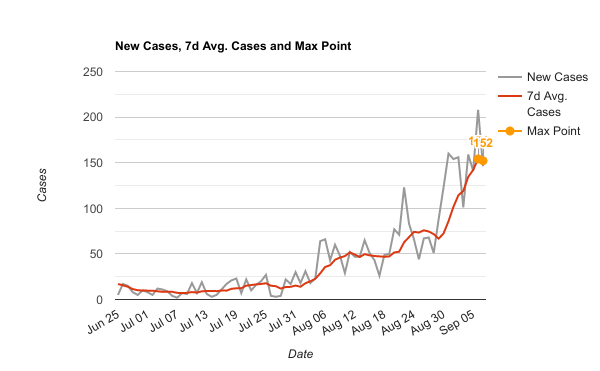 Chart returned by .getAs() |
Previously my fix was to use the setOption() method in the Chart service, which is highlighted in my original post e.g. builder.setOption('vAxis.format', '#');.
Aside: Finding all the chart options can be a real headache. Watching a recent episode of Sheets to Apps on How to build a Google Analytics Dashboard with Apps Script and Google Sites I learned that you can use the Google Sheets Macro Recorder to record a modification to a chart which then exposes all the setOptions(). As the Charts Service appears to only be a partial implementation of EmbeddedChart used in SpreadsheetApp Service not all of the ChartTypes and options are implemented.
Using the chart image download for the inline image
A solution I’ve found is to use the same url a user would use to download a chart as an image as the inlineImage blob source:

This can be called within your Google Apps Script project using UrlFetchApp with an access token generated with ScriptApp.getOAuthToken():
// Based on https://stackoverflow.com/a/22200230/1027723
function emailChartUsingImageUrl(){
  const idt = SpreadsheetApp.getActive().getId();
  const sheet = SpreadsheetApp.getActiveSheet();
  const charts = sheet.getCharts();

  // setup some variables for our email
  const chartBlobs = new Array();
  const emailImages = {};
  let emailBody = "Charts<br>";

  // setup our call to fetch the chart image
  const token = ScriptApp.getOAuthToken(); // project requires https://www.googleapis.com/auth/spreadsheets scope
  const baseUrl = `https://docs.google.com/spreadsheets/d/${idt}/embed/oimg?access_token=${token}&disposition=ATTACHMENT&bo=false&filetype=png&oid=`;

  // for each chart fetch the download image as a blob and appended to our email body
  charts.forEach(function(chart, i){
    // NEW BIT
    const url = baseUrl + chart.getChartId();
    chartBlobs[i] = UrlFetchApp.fetch(url).getBlob();
    emailBody +=  "<p align='center'><img src='cid:chart"+i+"'></p>";
    emailImages["chart"+i]= chartBlobs[i];
  });

  // Send email with inline images
  MailApp.sendEmail({
    to: "[email protected]",
    subject: "Email Charts - get chart from image url",
    htmlBody: emailBody,
    inlineImages:emailImages});
}
The result of this is you will get the chart image in your inbox as rendered in your Google Sheet:

If you would like to test this solution yourself you can also make a copy of this Google Sheet example.
Summary
The embed url used in this solution isn’t officially documented and as such Google may close/modify this without any notification. The scope required for this script to work needs the full spreadsheet access https://www.googleapis.com/auth/spreadsheets, rather than limited to current spreadsheet only.
This script is also hopefully a starting point for you to really go to town with the layout of your emails and include multiple charts and other html layout (if I have time I might revisit showing how this could be used in my mail merge solution).